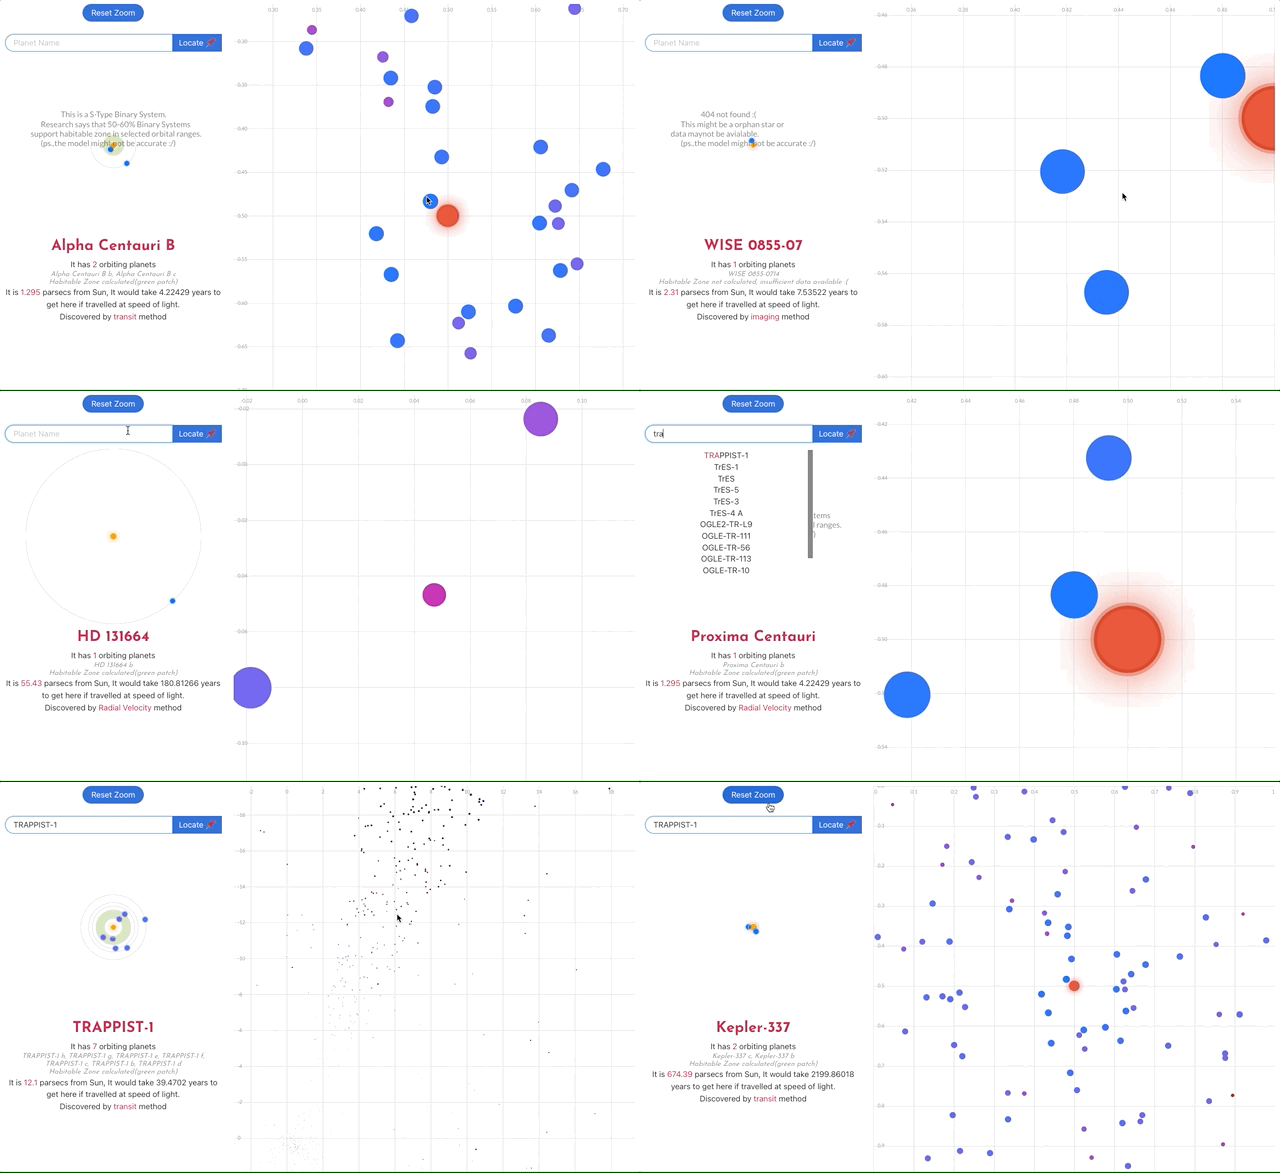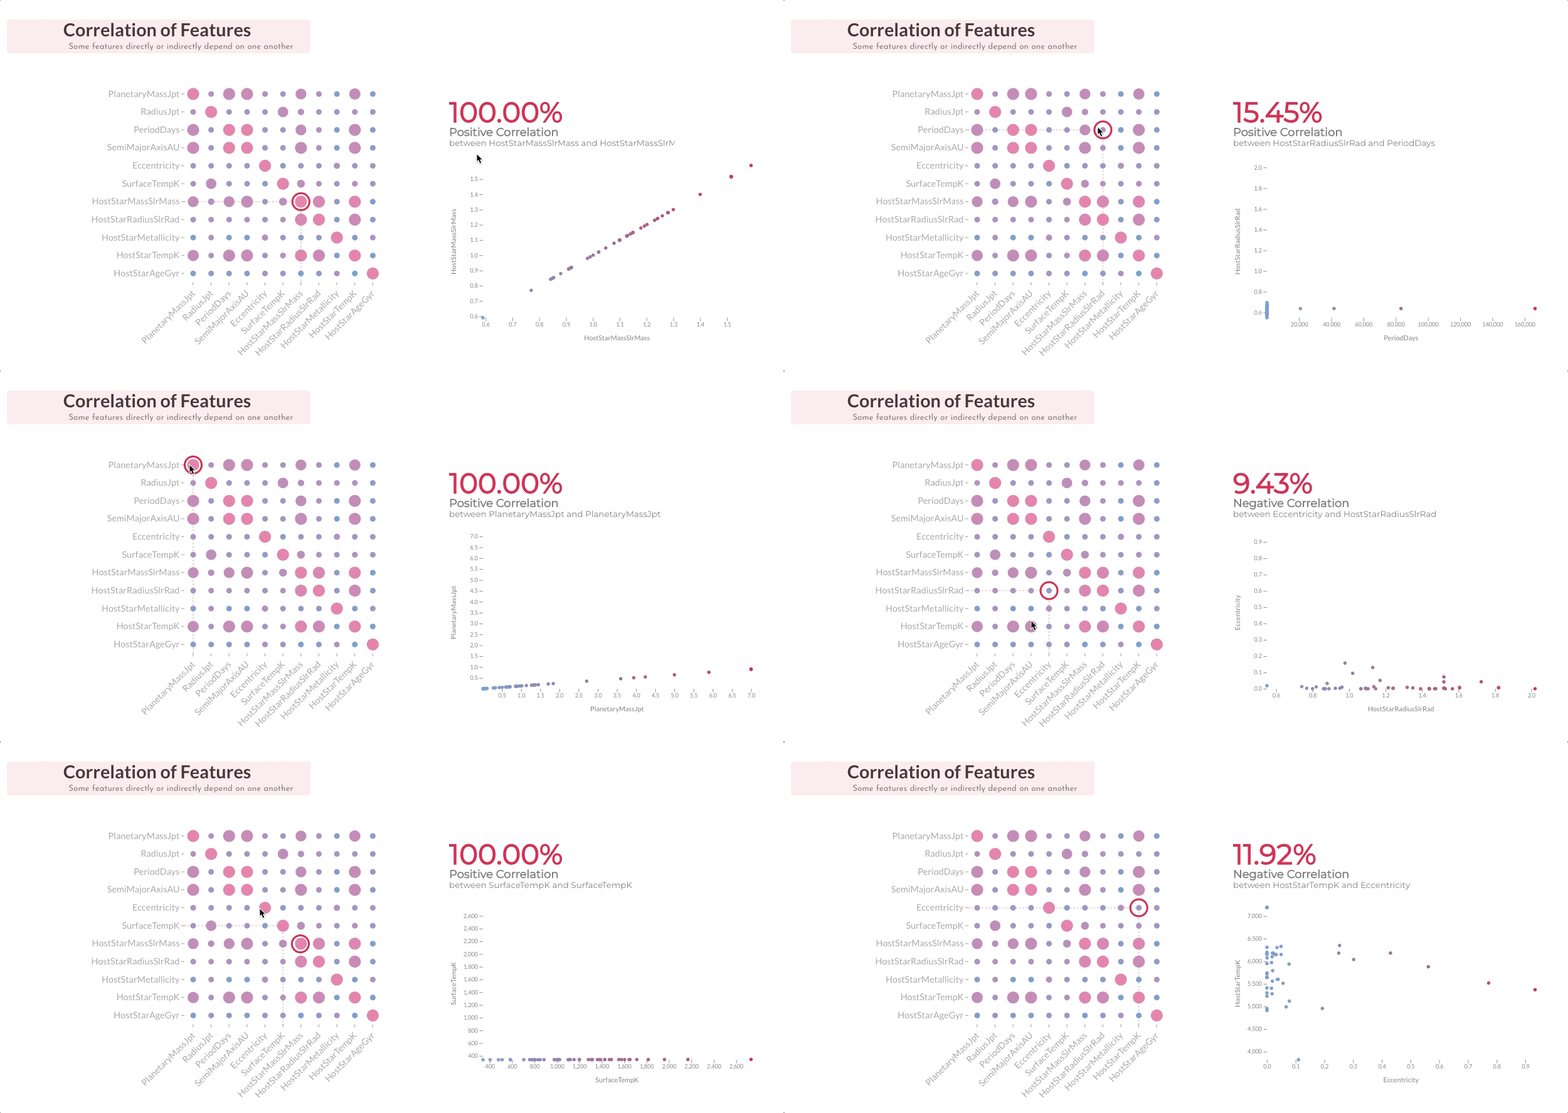
Exoplanet Explore is a Data driven Visual Analysis of Exoplanets. The project is made for data analysis hackathon by hackerearth. It won first prize! The project took about 15 days to build. It was an awesome experience.
I was a space geek since birth, I never stopped gazing at the sky and thinking about the stars and planets. It blows my mind if we think how miraculously small and alone we are in this infinitely expanding cosmos. I had the Kepler Telescope findings and NASA's official analytic data at my disposal. I barely had any knowledge about data visualization and analysis using programming. But the raw interest that I had in space exploration drove me through the learning process of programmatic data visualization. I had somewhat past experience in full-stack web development. with all these skills and my enthusiasm, I solely finished this project in a month. It was a wonderful, memorable experience. I loved every second sculpting this project from the scratch
Technically, the project is built with plain old HTML, CSS, JS with D3.js for data viz and python pandas for initial data exploration and cleanup